Room Overview
This room is part of a series of rooms that will introduce you to reverse engineering software on Windows. This is going to be a fairly short and easy room in which you will be introduced to how higher-level concepts look at a lower level. You will also start to get familiar with IDA. We will use the skills learned here to perform more advanced reverse engineering techniques in future rooms.
The programs provided in this room are compiled with MSVC (C++ compiler built-in with Visual Studio) set to release mode for x64. Debug binaries and symbols will not be used to teach with, however, debug symbols will be provided for those who are curious. This is done to make everything as realistic as possible. Debug symbols are a luxury when reverse engineering, and aren’t common when dealing with executables.
Get Hands-On
When running the samples on their own, outside of IDA, run them via the command line.
Use the VM provided alongside this room to get hands-on with the material. This will greatly improve your experience and learning in this room. The VM has IDA Freeware installed along with the samples for the room.
VM Credentials:
- Username: thm
- Password: THMWinRE!
Quick note for the VM: When you load an executable into IDA you will be asked for debug symbols (a PDB). Say no to this. A further explanation as to why will be provided in the next task. If you attempt to download symbols IDA may crash.
Bring your own VM!
While the VM hosting on THM is great, they do have their limitations. Things such as processing power and internet access will make some tasks more difficult and it’s for those reasons why I highly recommend you make a VM on your own computer. All you will need to do is install IDA Freeware and get the programs we will be reverse engineering.
IDA Overview
Tool Introductions
In this room, we will be using IDA Freeware. Historically the downside to IDA has always been its pricing, however, thanks to recent developments in other tools, the free version of IDA now has many more features than it used to. Other good tools include x64dbg, Ghidra, WinDBG, Radare2, and of course GDB. My daily drivers are x64dbg and Ghidra. IDA is used for this series since it’s easy for beginners and results in us only having to use one tool.
First, let’s discuss static vs dynamic analysis. Static analysis involves looking at the program as it exists on disk; The program is never executed. Dynamic analysis involves analyzing the process as it runs. Dynamic analysis is usually preferred unless dealing with malware. Dynamic analysis allows you to see data in memory and how it’s being used. Static on the other hand requires you to guess or do detailed reverse engineering to figure it out.
There are three main functionalities that our tools will provide, those are debugging, disassembling, and decompiling. Disassemblers will translate the program from its bytes on disk or in memory into its assembly code equivalent and present it in an informative way. Decompilers are similar to disassemblers except instead of giving us the assembly, it attempts to recreate the code in C/C++. The downside to decompilers is that they can be inaccurate, or lack information. Because of this, if you’re using a decompiler it’s a good idea to have the disassembled code next to the decompiled code to check for inaccuracies. Debuggers, alongside disassemblers and decompilers, will allow us to place breakpoints within the program while it’s running and analyze registers, memory, statuses, and more. They also allow for changing data in memory while the program is running.
IDA Overview
IDA is quite an extensive tool, I will only show you what you need to know. I highly encourage you to learn more about how to use IDA on your own time. It’s not difficult to use, rather there’s just a lot to it. For the following explanations, I will be using notepad.exe (C:\Windows\System32\notepad.exe).
To load a program into IDA you can start IDA then follow the prompts, or you can alternatively just drag and drop the executable file onto the IDA icon on your Desktop. While loading the program into IDA it will prompt you about the type of file, you can just stick with the defaults. At some point, you will be asked about debug symbols (PDB). In the real world, get any debug symbols you can. Normally you will only have the debug symbols for Windows libraries. For the sake of this room, we won’t use any except for what comes with the system by default.
Debug Symbols
Debug symbols are extremely helpful and you should use them when you can. Unfortunately, you will usually only have debug symbols for common libraries and rarely for the executable of interest. In addition to that, most reversing tools download symbols for common libraries so if you don’t have an internet connection you won’t get them. Note that because of this, don’t attempt to download symbols in IDA when using the VM otherwise you will get errors and it may crash. In this room, we will go over the samples without their debug symbols to maintain as much realism as possible. However, for further learning purposes, debug symbols will be provided if you wish to manually load them.
Code Views
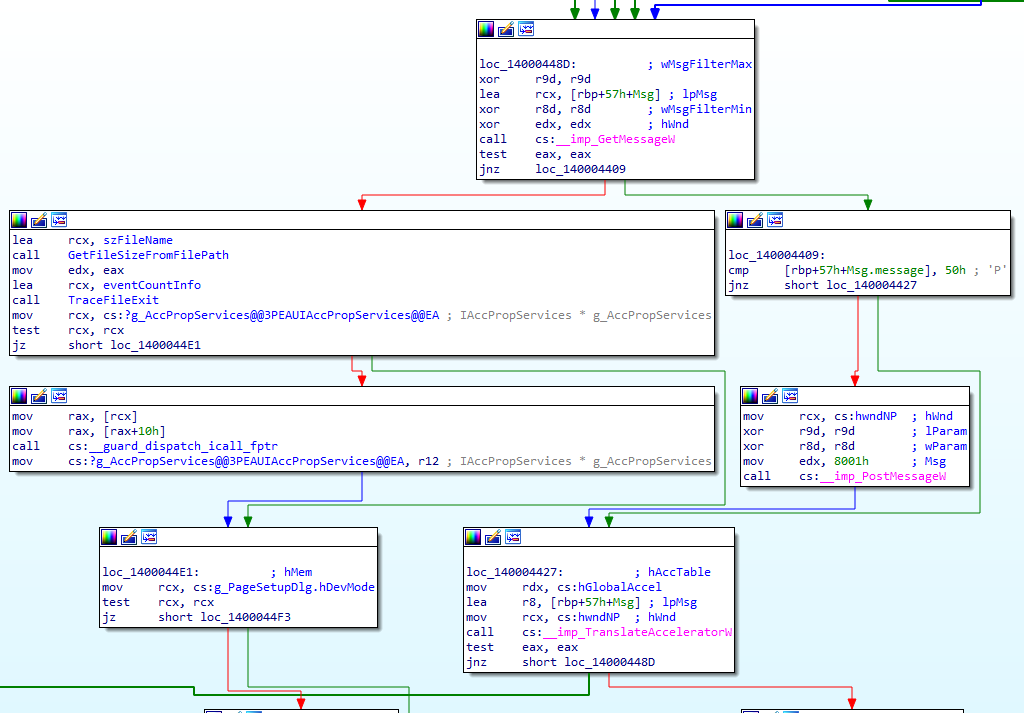
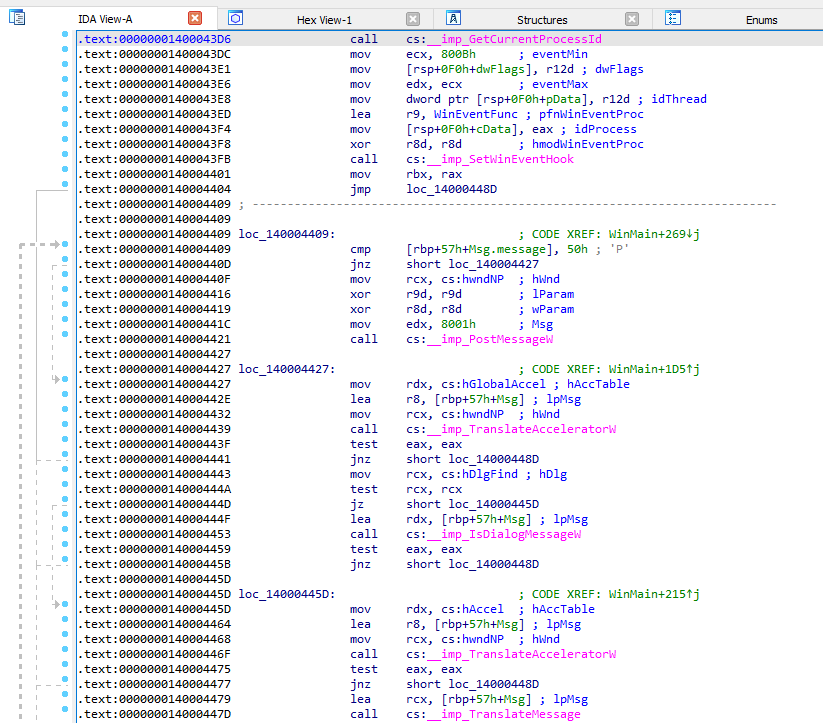
The two primary views, listing and graph view, show the program in its disassembled form. You can switch between the two by pressing the space bar. I recommend you spend most of your time in graph view, as it shows the flow of the program.
As you can see in the graph view, the arrows represent the destination of jump instructions. This is incredibly useful and a massive time saver.
In the listing view, you can see slightly more information, however, it’s much harder to understand the flow of the program.
You may find it helpful to enable Auto Comments by going to Options > General > Disassembly (Selected by default) > Auto Comments Play around with it on/off and see if you like it. I found it useful when I started since it describes what is happening in the assembly.
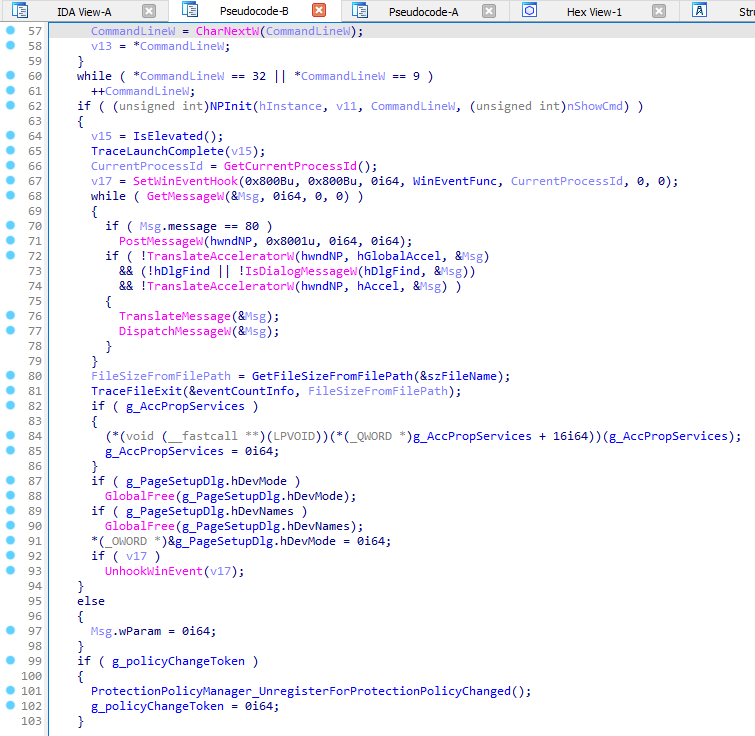
IDA also has a decompiler. Do not become reliant on decompilers as they aren’t always accurate and often have issues representing every instruction in longer sections of code. With that said, they are a great place to get a general idea of what’s going on. To decompile, IDA calls it pseudocode, you can click on the area of code you want to decompile and press F5. You can also go to View > Open Subviews > Generate Pseudocode.
I will not be utilizing the decompiler feature of IDA for this series of rooms.
Imports/Exports
These tabs are pretty self-explanatory. The imports tab shows all of the functions imported by the current program from other sources. The exports tab shows all of the functions exposed by the current program. Note that the exports of an executable usually contain only the entry point (where the program starts executing from).
Functions
On the left, you can see the Functions window which shows the identified functions for the current program. Depending on what symbols you have access to, you may have more or less functions with actual names. If there are no symbols to identify a function, it will instead be given a generic name such as sub_140001000 where 140001000 is the address of the function.
Other Subviews
You can find other useful tabs/subviews under View > Open Subviews. I encourage you to play around with the different subviews as there’s a significant amount of information found within them. One subview in particular which you should get familiar with is the Strings subview. Here you can view all identified strings in memory. This can be helpful, as we will see later when finding a certain function or place of interest. Further Learning As mentioned, IDA is packed full of stuff. I highly recommend you play around and get familiar with IDA. There are loads of guides, videos, and even books out there to assist you!
Function Prologue/Epilogue
Remember how functions need stack frames? Function prologues and epilogues will set up, create, and destroy stack frames according to the calling convention in use. I will introduce them here and point them out as we encounter them on our journey.
Prologue
The prologue comes before the body of a function is executed. Not all prologues are the same, but here are three things that can happen and the order they usually happen in.
- Volatile registers are saved. If there is shadow space available, and the appropriate compilation options are chosen, the shadow space can be used to hold volatile registers. If there is no room in shadow space then registers are pushed onto the stack.
- Space is allocated for the stack frame by subtracting from RSP. The amount subtracted from RSP can be used to determine the number of function parameters.
- RSP or RBP may be preserved to be restored later. Since RBP isn’t used much for stack purposes in x64 when it gets preserved it’s likely not being preserved to keep a stack address safe, rather it’s being treated the same as the other volatile registers. In the case that it is being used for stack purposes, you may see something along the lines of
mov RSP, RBPwhich moves RSP to where RBP was at, setting up a new stack frame right next to the previous one.
Generally speaking, it’s fine to skim over the function prologue, however, note that it can hint at how many parameters are passed to the function.
Epilogue
The epilogue is pretty straightforward, it undoes/unwinds any stack-related things, mostly caused by the prologue. The epilogue can be a nice place to double-check you didn’t miss anything within the prologue, but it’s generally more useless to a reverse engineer than the prologue.
You may see the following in the epilogue:
- Addition to RSP to restore/delete the stack frame.
- Restoring registers, usually done by popping registers off the stack which were pushed on the stack during the prologue.
- Return.
That’s all there is to most epilogues.
Quick side note, you may have heard that nothing on disk is ever actually deleted. When you delete something the OS simply marks that area on disk as not being used so the OS knows it can write to that location without overwriting anything important. This is why data removal software exists. It will go in and fill in the area with zeroes or junk data so the original data is removed. Similarly, nothing gets deleted from the stack by the prologue or epilogue. When the next stack frame is made it will be put right where the old one was and there will still be data there. This is why you should initialize variables upfront, because otherwise, your variable may contain garbage from the previous function/stack frame.
Function Call Sample
When running the samples on their own, outside of IDA, run them via the command line.
Before you load the program into IDA, I want to quickly repeat a warning. When you are prompted for debug symbols do not do it. This is to maintain realism. If you wish to use debug symbols for further learning on your own, you can load them manually after the program is loaded into IDA. The debug symbols are provided in a folder on the Desktop along with the samples. If you attempt to download symbols IDA may crash.
Getting Started
Let’s take a look at a sample that calls a function. For this task use HelloWorld.exe. It’s usually a good idea to run the program before doing any reverse engineering, so go ahead and do that. Again, when you run the program do so from a command prompt since the program closes very quickly.
We are going to start from main(), find it in the function list if IDA doesn’t navigate to it automatically. The main() function should look something like this:
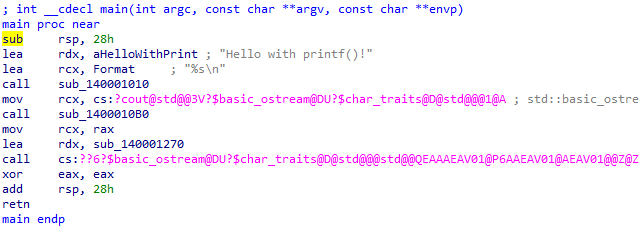
Notice the sub RSP, 28h at the top. For this function that’s the entire prologue. It’s setting up the function by moving the stack pointer and creating a new stack frame area.
printf()
For now, we will focus on the first function call within main(), which is a call to printf(). IDA does not resolve that this is printf(), so instead, you can identify it as such based on the parameters passed and what it does when the program runs. IDA shows two strings loaded into the first two parameters for the function call. The first parameter (passed via RCX) is the format string “%s\n”, the second parameter (RDX) is the “Hello with…” string. Immediately after the two parameters is the call. In IDA you can rename the sub_### to whatever you want by right-clicking and going to Rename or by selecting the function and pressing N. Renaming variables and functions is very useful when dealing with bigger projects.
That’s it for the call to printf(). The first parameter is the format string, the second is the “Hello…” string, and printf() makes the magic happen. Feel free to look into printf() more if you’d like.
std::cout
Now let’s look at the second function call which is to std::cout.
We can identify it’s std::cout without using the string printed to the console because we can see things related to cout, basic_ostream, and char_traits. You may notice the names of the functions are quite odd as displayed in IDA. We will discuss this in the DLL section, but in short, the names are mangled for function overloading. For now, look past the name mangling. With that said, you may not be familiar with those functions so the first thing to do is look them up. Here’s a brief overview of them all:
- basic_ostream - C++ template for output streams. More info here.
- char_traits - Provides some abstraction from basic character and string types.
- cout - std::cout - Sends text to the console.
Now to address the elephant in the room. Where is the string that’s supposed to be printed? Let’s find it.
To find our string go to View > Open Subviews > Strings or press Shift + F12. Note that this may take a bit to process. Then look for the string in the list. You can use Ctrl + F to search. Double-click the string in the list and this will bring you to the string where you can see all references to that string. IDA calls these XREFs, short for cross-references.

The string only has one reference, so double-click it. This will bring you to the location of the string which is in a very large function.

The string is very clearly not where we would’ve expected it to be. We can see sputn, which long story short means we’re dealing with character streams. So what is this massive function and what is it doing? If you go to the top of the function in the listing view you can see what references it. Sure enough, main() references this function. So what’s going on here?
Inlining
One compiler/linker optimization that makes noticeable changes to the code is inlining. When a function gets inlined it’s essentially pasted where the call would be instead of making a call. See the following example.
Without Function Inlining:
1
2
3
4
5
6
7
int Add(int x, int y){
    return x+y;
}
int main(){
    int x = RandInt();
    int res = Add(x, 5)
}
With Function Inlining:
1
2
3
4
int main(){
    int x = RandInt();
    int res = x + 5;
}
What’s happening with our string in HelloWorld.exe is similar. Instead of the string being passed as a parameter to std::cout, it’s directly referenced in std::cout. You may think that this would cause problems because what if std::cout is called to print a different string? You’d be correct, this would cause problems for further calls to std::cout. As it turns out if std::cout is called more than once you will not see this optimization used. Instead, you will see it used similar to how printf() is used.
I encourage you to write a program to play around with this to develop a deeper understanding of it. You may have noticed that there’s some interesting stuff with std::cout that I skipped over. In short, it has to do with function overloading, basic_ostream, and streambuf which deals with character streams. If you’re interested, simple searches of those things will bring you some useful information.
That concludes the basic function example. It’s really easy to understand function calls as long as you know the calling convention used. Luckily for x64 Windows it only uses fastcall, but other systems and architectures will likely not be that nice. Be sure to know whatever calling convention you’re dealing with well, it will make your work much easier.
In the HelloWorld.exe sample, which instruction sets up the first parameter for the call to printf()? Provide the full instruction as shown in IDA, with single spaces. Example: mov RAX, RBX.
lea rcx, Format
Loop Sample
It’s highly encouraged to follow along for this portion in your own VM, as it will make it must easier for you to understand. This task uses Loop.exe. Load it into IDA and go to the main() function. The graph view is highly recommended.
I’m also going to state now and multiple times to keep the bigger picture in mind. Don’t analyze one instruction at a time, it usually requires multiple instructions to perform one high-level action. It’s also important to point out that we will be making assumptions. You won’t always know what something is or does, which is why you make your best guess. As you go, use your guess to attempt to understand what’s going on while at the same time validating/testing your guess.
At a high level there are three main types of loops used: For, While, and Do-While. When working on a low level you’ll usually see a do-while and sometimes a while. Keep in mind that a for loop is only an abstracted while loop. When dealing with loops expect to see a counter/iterator register initialized at the beginning and incremented/decremented at the end. The condition for the loop is usually at the end since that’s when you would determine whether or not to continue the loop. There is often a condition at the start as well which would be a check to skip the entire loop. There may also be conditions within the loop that break/jump out of the loop.
Reversing Our First Loop
Before we throw it into IDA, as always you should run it. After running it the purpose seems to be to get input from the user and count the number of lowercase characters then output the result. Simple enough, you could probably guess how it works without having to do any reversing, but let’s take a look so we can learn since it won’t always be that easy.
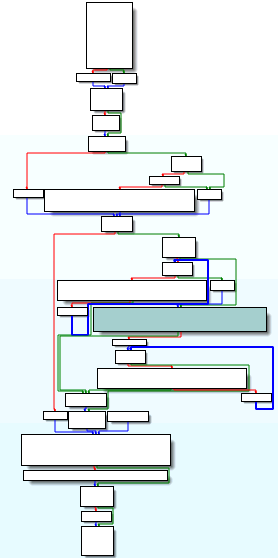
Go ahead and load Loop.exe into IDA and go main(). You may notice it’s quite large. I would encourage you to use graph view, it makes understanding the flow of the program much easier. Once again, press Space to quickly switch between the graph view and the listing view.
Initial Analysis
To start let me introduce you to the best skill to develop as a reverse engineer. It’s being able to skim over the unimportant stuff otherwise you’ll waste your time and go into a rabbit hole. In the graph view, we can see a big box at the top. Looking at it we can see that it mostly just prints stuff so we can skim through it just to make sure there’s nothing important. Looking towards the bottom of the big box, which I will refer to as the loop initialization part of the code, we can see some interesting stuff.
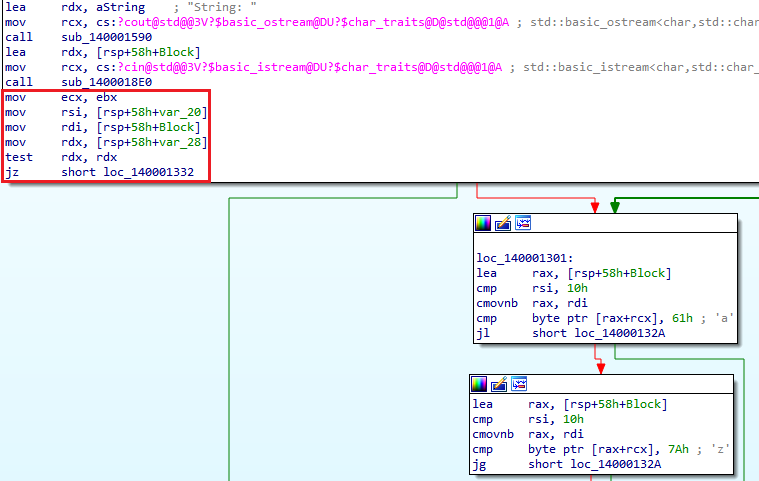
The reason why it’s interesting is for two main reasons. First, it doesn’t appear to be printing anything like the previous lines were. Second, there’s a loop following it which we can quickly identify because of the arrows provided in graph view. Let’s start our analysis by taking a look at mov rsi, [rsp+58h+var_20] since it seems to be the start of the difference. Important: Don’t forget about the code we just skimmed over. If we get lost or need more information (foreshadowing) one of the first things we’ll do is go back to the code we skimmed over.
Looking at the move into RSI, RDI, and RDX we don’t get much since the data is uninitialized. Notice the test RDX, RDX as it can reveal a little extra. Testing a register against itself will test if the register is zero. In this case, if RDX is zero it jumps past the loop because of jz short loc_140001332. Based on this we know that RDX shouldn’t be zero, since if it is, it appears to fail/skip the loop. Since we are iterating over input we can guess RDX is most likely the length of the string, but it could also be checking if a buffer is empty. One of the nice things about IDA is it can determine if data is a buffer or just a normal data type such as an integer. You can see that two of the moves involve var_##, and another uses rsp+58h+Block. This means that the move into RDI involves a buffer and the moves into RSI and RDX are normal data types. We can now solidify our guess that RDX is the length of the string since the loop is likely to be iterating over the string. We’ll keep this in mind as we move forward to both verify our guess and better understand what the loop is doing.
Analyzing The Loop
The first thing I like to do is go to the end of the loop to identify the register being used as the counter and the end case for the loop. The key to finding the counter is identifying the register which gets incremented or decremented. The end case for the loop can be identified by a comparison to the counter.

At the bottom, you can see RCX being incremented then compared to RDX. In other words, the counter is compared to what we assume is the length of the string. Now we know RCX is the counter and the condition between RCX and RDX is the end condition. This also solidifies that RDX is the length of the string.
Now let’s look at the first block involved in the loop.
Loop Block 1

Once again, you must try to understand multiple instructions together since they likely come together to perform one task.
We see the address of the buffer (identified because of “Block”) being put into RAX, so RAX is how the string will be referenced in the loop.
What’s this weird RSI comparison and the cmovnb? The cmovnb instruction is a conditional move if not below. This is saying move RBX into RAX if RSI is not less than 0x10. You could also think of it as if RSI is greater than or equal to 0x10.
- Let’s find out what RDI is. In the initialization block (the big one) at the bottom, we see that the string buffer is moved into RDI (
mov rdi, [rsp+58h+Block]). Since RDI is 8 bytes, the first 8 bytes of the buffer are moved into RDI. Note that, unlike RAX, RDI does not contain the address of the buffer. RAX was given the address because of theleainstruction whereas RDI is given the first 8 bytes (based on the size of the RDI register) of data within the buffer because of amovinstruction. - Now for RSI. We can see at the bottom of the initialization block that RSI is set to an unknown value (
mov rsi, [rsp+58h+var_20]). Keep looking to find what modifies that variable and you will see towards the middle of the first block that it’s initialized to 0xF (mov [rsp+58h+var_20], 0Fh). Unless RSI or RSP+58h+var_20 are modified elsewhere, thecmovnbwill never occur since 0xF is below 0x10. - So what exactly is all of this doing since it doesn’t appear to be related to the loop? We will come back to this, for now since it doesn’t seem to affect the loop we will ignore it.
Next, there is a comparison between RAX+RCX and 0x61 (ASCII “a”) then a jump if less than. This is getting an offset in the string with the distance being the loop counter (RCX). The RAX+RCX is the same as string[index] or RAX[RCX] in a high-level language, where RCX is the index/offset that is added to the base address of the string contained in RAX. Now let’s break that down in a more understandable way. It will compare the current character in the string being iterated over against the character “a”. If the current character is less than “a” it will skip to the final block in the loop which will start the next iteration. Otherwise, it will continue to the second block. So the good outcome, in this case, is that the character is greater than or equal to “a” since it wouldn’t skip to the end of the loop.
Once again remember the bigger picture. The goal of this program is to count lowercase characters. The behavior we just analyzed makes sense, a lowercase character is not going to be less than the ASCII value of 0x61.
Part 2
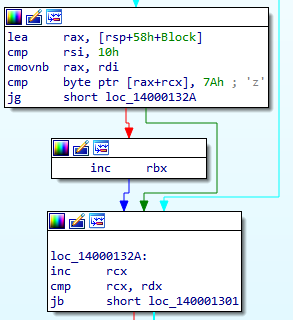
The second block does almost the same thing as the first, except it compares the current character against “z”. If it’s greater than then it will jump to the end. However, there is something very important that is easy to skip. Notice RBX is incremented. The condition in which RBX is incremented is if the current character is not less than “a”, and not greater than “z”. In other words, if it’s a lower case character (a-z) RBX is incremented! So RBX is going to hold the result of how many characters are lower case.
Finally, at the end of the loop, the loop counter (RCX) is incremented then compared to the length of the string (RDX) and jumps if below to the start of the loop. Otherwise, it continues to the code after the loop.
Part 3
Now to look at the rest of the function to see what else there is and maybe find out what was going on with RSI and all of that cmovnb business. First look at the big block after the loop.

It appears it is printing the results out as seen when we ran the program. Towards the bottom of the block we see something familiar though, a comparison between RSI and 0x10. If RSI is less than 0x10, it will jump to the function epilogue. Based on this we can assume that RSI and 0x10 have something to do with error handling, possibly input validation or parameter validation. Looking further at the few small blocks at the end of the function it seems the assumption is correct.
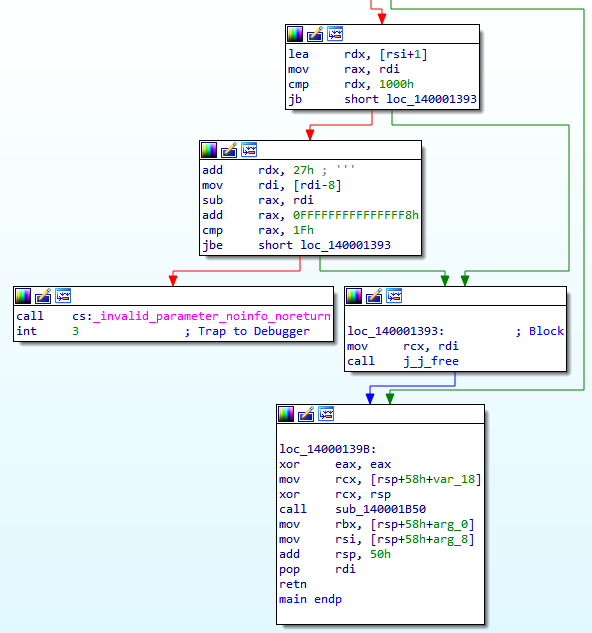
It further compares RSI and we can see functions related to invalid parameters and freeing memory. Remember earlier when I said a good reverse engineer knows when to skip stuff, this is that time. RSI doesn’t seem to be tied to the loop or user input, instead, it appears to be generated by the compiler. Because of this, we will avoid the rabbit hole and not dig deep into it, however, feel free to do so if you’d like.
That’s all there is to it! With enough practice and experience, this sort of task could take you a mere few seconds. As a beginner, this sort of thing can be a bit confusing, which is why we broke it down. Ironically, breaking it down can sometimes make it harder to understand which is why it’s vital to keep the big picture in mind, analyze multiple related instructions together, and make guesses when you need to. Of course, be prepared for your guess to be wrong.
In the Loop.exe sample, what instruction is the key to finding out what register is the counter? Provide the full instruction as shown in IDA, with single spaces. For example: dec RAX.
INC RCX
Structures
Structures are very common in modern software, especially with Windows. The entire Windows OS is highly object-oriented. The general definition of a structure is a data type that holds multiple pieces of data. To start, let’s look at arrays which are essentially the most bare-bones data structure you can get.
Arrays
Arrays store multiple pieces of data which are the same type sequentially in memory. Let’s say you have an array of 5 integers that starts at the address of 0x4000. The size of the array is 20 bytes since each integer is 4 bytes. The first integer is at 0x4000+0x0, the second is at 0x4000+0x04, and so on. Arrays are usually easy to analyze, like the character array (string) we encountered in the loop task.
Classes
Classes can have multiple pieces of data which are of different types. This is what makes them harder to work with when reversing. To figure out the layout of a class, you will have to do some analysis. You need to figure out not only how many things are in the class, but also their data types. There is quite an extensive number of ways to do this, but it generally comes down to just looking at the functions which use the class and paying close attention to how they use it. We will take a look at reverse engineering a class structure in a future room. For now, I’ll give you a crash course.
Let’s say we have the following class:
1
2
3
4
5
6
7
8
class Human {
public:
	int age;
	float height;
	char* name;
	Human(char* newName, int newAge, float newHeight)
		: age(newAge), height(newHeight), name(newName) {}
};
This class’s data will take up 16 bytes. 4 bytes for the age, 4 bytes for the height, and 8 for the name (pointers hold addresses and addresses in x64 are 8 bytes). How would this be identified in assembly? Let’s say a pointer to the class is contained in RAX, and the address of the class is 0x4000. Here’s some pseudo-assembly:
1
2
3
4
5
6
mov RAX, 0x4000     ; RAX = Address of the class and the age variable (offset 0)
lea RBX, [RAX+0x4]  ; RBX = Address of height
lea RCX, [RAX+0x8]  ; RCX = Address of name
mov [RAX], 0x32     ; age = 50
mov [RBX], 0x48     ; height = 72
mov [RCX], 0x424F42 ; name = "BOB"
As you can see we have the base address stored in RAX, and the items of the class are accessed via offsets. One of the things to pay attention to when dealing with classes is the use of addresses/pointers and the lea instruction. This is done because you usually want to access the data in the class, not a copy of it.
Dealing with classes is usually not too bad, but sometimes you aren’t given the full class. For example, it’s common for some parts of a class to only be referenced once such as some header information, so you have to be careful. Once again we’ll take a look at an actual structure in a future room.
DLL
The process for reverse engineering a DLL is mostly the same as executables, but they are usually easier since you can see more function names. It’s also more common to see debug symbols provided with DLLs than it is to see them with executables.
Imports, Exports, Modules
You’ve probably seen many function names that are all nonsense. As mentioned earlier, most function names do not survive through compilation since they are just there for human understanding. You may, however, notice that some names do exist. This could be because of two main reasons.
- First, the tool recognizes the function and names it accordingly. IDA does this with FLIRT (Fast Library Identification and Recognition Technology) signatures. FLIRT signatures are used to identify standard library functions. The general idea of how they work is they search memory for a chunk of bytes that match a known chunk of bytes in a standard library function. Once a match is found, the function can be named accordingly. You can learn more about FLIRT signatures on the IDA/Hex-Rays website. The main() function is a little more difficult since its signature is different for every program. However, IDA can still sometimes find it using some tricks. One commonality of the main() function is that it’s called from the program entry point, usually towards the end. There’s also usually a test against the return value of main() to determine if anything other than zero was returned. You can use that knowledge to help find the main() function, and there are several other ways as well. I won’t get into this here as it can get quite long and advanced. I highly encourage you to do your own research on this.
- Second, its name may be preserved because it’s imported from or exported by a DLL. For a developer to use a function from a DLL the developer needs to know and be able to resolve the name of the function they want. Because of this, the names have to stay intact. The DLL can expose its function names through the DLL/PE header, library file, or header file (.h or .hpp). The library and header files are not required, but they are usually included.
Imports are the functions the executable is using/importing from a DLL, and exports are the functions a DLL provides/exports. DLL’s are known as dynamic-link libraries since they are loaded into memory once and can be loaded into any number of processes at any time without making any more copies. The Windows OS is built on DLLs.
Modules are essentially anything related to a process that import or export functions. For example, Loop.exe includes modules such as ntdll.dll, kernel32.dll, etc. If you were to run Loop.exe, while it is running Loop.exe itself is considered a module of the process.
Name Mangling/Decoration
C++ function overloading allows you to have two different functions with the same names that take different parameters. This becomes a problem when a DLL is exporting functions since the exported names will be the same. For developers, this problem is solved by using libraries and header files. On a lower level, this problem is solved by mangling the names so they are unique. ALL exported C++ function names get mangled whether they have overrides or not.
Function mangling is also called function decoration, which is probably a more appropriate name just not as popular. Although the mangled names may look like random garbage, there is a method to the madness. Here is an example of a mangled function name: ??0?$_Yarn@D@std@@QEAA@PEBD@Z. As random as it may seem, it can be decoded. By de-mangling the name you can find the function type and parameter types. Different compilers use different mangling schemes, in this series of rooms everything uses the Microsoft C++ compiler and mangling scheme. You don’t need to know how the schemes work since reverse engineering tools can decode them, but if you’d like here are some links.
- Microsoft C++ Mangling Scheme: http://mearie.org/documents/mscmangle/
- More Mangling Schemes: https://en.wikipedia.org/wiki/Name_mangling
Side note for the programmers out there. Putting extern "C" before a function makes it use C linkage, thus removing the name mangling. This does prevent you from overloading the function.
Running DLL
When reverse engineering a DLL you may want to run it so you can analyze it in a debugger. This presents an obvious problem, you can’t simply run a DLL. Here’s a bit more detail on how DLLs work.
When a DLL is loaded, the function DllMain() is executed within the context of the process which loads the DLL. Here the DLL can run whatever code it wants.
You may have heard of DLL injection, this is one way it can be done. You can get the target process to call LoadLibrary() on your DLL which will cause DllMain() within your DLL to be executed within the context of the target process.
There’s a program that comes with Windows called rundll32.exe which does pretty much that, it just loads your DLL making DllMain() execute. As a developer, you can make rundll32.exe execute functions within the DLL, but I don’t think anyone does this.
For reverse engineers, what if we want to dynamically analyze a function within a DLL? The best way to do this is to write your own code which calls the function you’re interested in. Without a library or header file, here’s one way (there’s probably a more elegant way) in which you could call a function within a DLL with only the .dll file. This does not include any error handling, it’s only the code of interest. It’s a call to a function called Add() within the DLL named DLL.DLL:
1
2
3
4
HMODULE dll = LoadLibraryA("DLL.DLL");
typedef void(WINAPI* Add_TypeDef)(int, int); // Add(int x, int y)
Add_TypeDef Add = (Add_TypeDef)GetProcAddress(dll, "Add_MangledName");
Add(1, 2);
Unless you have a header or library file, you will likely need to reverse engineer the function to find out what parameters are passed to it.
That’s all there is to DLLs since other than all of that they are the same as executables when it comes to reverse engineering.
A DLL is an executable on easy mode.
Conclusion
That’s the basic hands-on introduction to reverse engineering Windows, hope you enjoyed it! Hopefully, you are somewhat more comfortable with reverse engineering software now that you have seen it and had the opportunity to be hands-on. Next room we will finally get into some real reverse engineering taking a look at a set of functions exported by NTDLL. It’s going to be quite a step up but I think it’ll be a great way to learn. For those who are interested, we will then use our knowledge to write code that uses the functions. Trust me when I say reverse engineering can be a bit of a drag to learn, but it’s much more fun once you finally know what you are doing and can start researching on your own.
Here are some places you can learn more about IDA:
- https://www.youtube.com/playlist?list=PLKwUZp9HwWoDDBPvoapdbJ1rdofowT67z
- https://www.youtube.com/watch?v=tt15P5Om3Zg
- https://hex-rays.com/products/ida/tech/flirt/in_depth/
If you have the time I’d recommend looking into Ghidra and, if you plan on sticking with Windows, x64dbg. Ghidra is a great alternative to IDA, just not as mature. The nicest thing about Ghidra over IDA is the price. Ghidra is free, IDA is expensive. So far we’ve been using IDA Freeware which is great but there are some serious limitations. With a price tag of free, Ghidra supports loads of architectures and is written in Java so it runs on pretty much anything. Its decompiler is pretty good, I do think the decompiler IDA has is better though.
